
If you haven’t seen it already, the new Kindletrends Dashboard is a really powerful way to dig deep into researching your categories of interest. In this article, I’ll give you a short overview of how you can use it, and show you some of the most valuable things you can do right away.
First, here’s an introductory video:
To start using the dashboard, click the big blue ‘Open the Dashboard’ button under the Week in Summary section in any newsletter. You’ll see all the information used to make the newsletter you’re reading, uploaded into an interactive online spreadsheet (powered by a tool called Airtable).
- There’s a ‘data’ view, which is basically like a spreadsheet, a ‘Cover Gallery’ view, which shows you all the covers, and a ‘browse’ view which gives you a bit more space so you can see thumbnails and read the start of blurbs.
- On the right you can see a few different charts and tables. There’s a list of popular tags, a price breakdown, and a breakdown by age. The charts and tables are real-time filtered by what’s in the data view: try filtering by a tag (e.g. ‘shifter’) and you should see them update.
- You can click the little ‘x’ on the right-hand side of the screen (it’s a really little ‘x’) to toggle the charts on and off if you need more real estate.
- Finally, you can export things as a text file or just cut and paste stuff. So if you want to read just the blurbs for ‘fated mates’ books above 2.99, you can just filter by that, then scroll over to the blurbs category, select them, and copy and paste them into Word.
Next, check out the Cover Gallery View
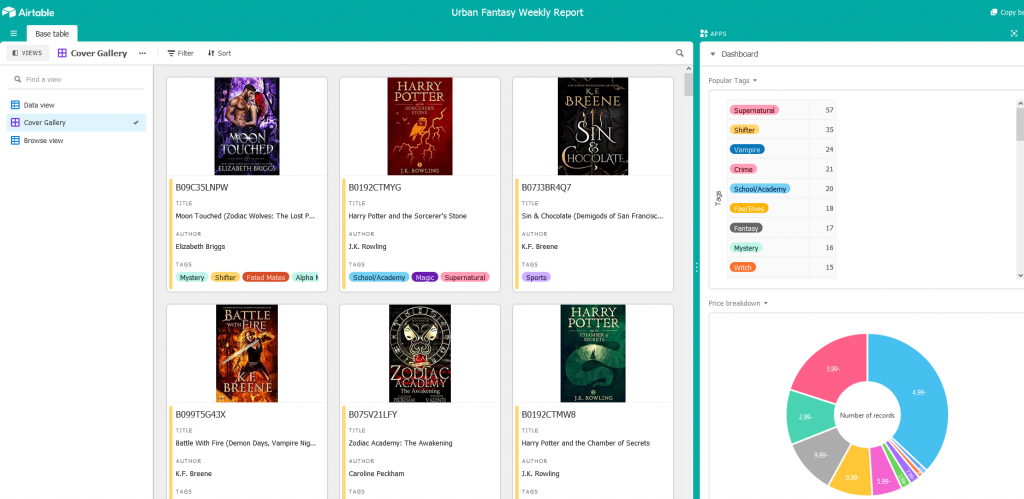
Click the Cover Gallery View link on the left sidebar. In the middle of the page, you’ll see each book in the dashboard, with the cover first.
- You can scroll down to look at all the covers, and click on individual books to see their details: blurbs, pricing, release date and everything else.
- If you’re interested in particular topics, click the ‘Filter’ button at the top, and filter books by Tag.
- For instance, filter by ‘Tag is Fated Mates’ to see all the covers for books with that tag.Use the ‘Sort’ button at the top to show the books you want to focus on first; sort by number of reviews, or by price.
Use the Browse View to look at blurbs against covers
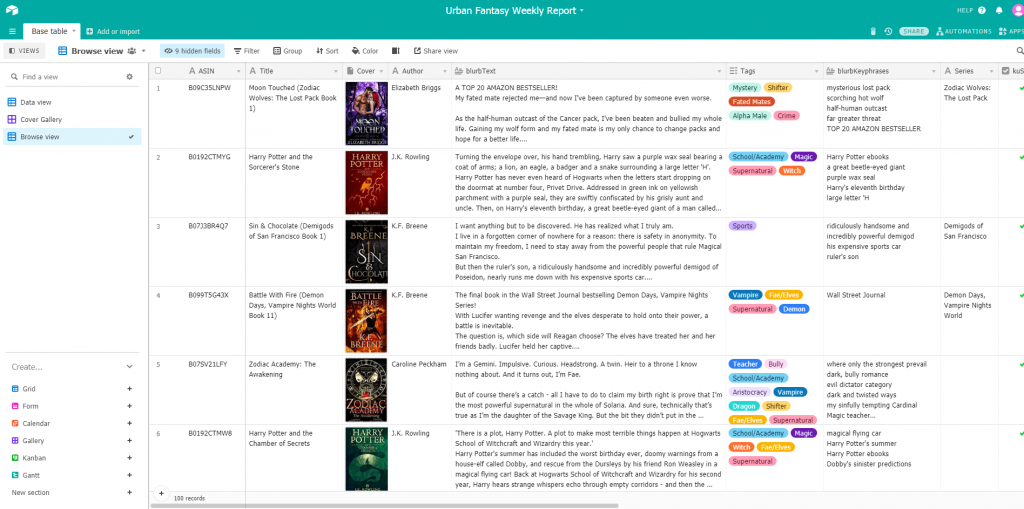
In the Browse View, you’ll see each book in a row, shown with a bit more space so you can read the blurb (here I’ve clicked the little ‘x’ on the right to hide the plots, so I can see even more for each book).
- Use this view to filter for specific books, and compare their blurbs with their covers. What elements on the cover are referred to in the blurb? Understanding the relationship between the two in your genre will help you optimise your own blurbs and covers.
- Just like the Cover Gallery View, you can filter and sort by Tags, by KU status or by anything else.
- To copy information out of this or any other view, click the little check boxes at the start of each row. You can paste each row into Excel, or into another spreadsheet program like Google Sheets or OpenOffice.
Scroll down the plots to see the Age Breakdown and the Books By Author plot
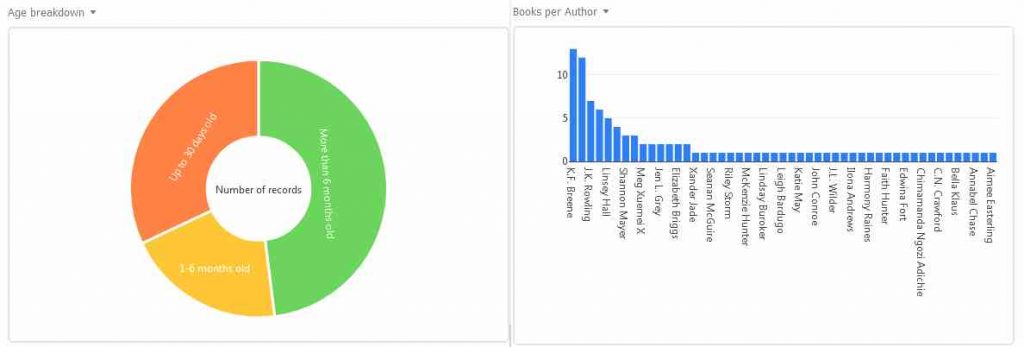
If you scroll down the plots on the right-hand side of the Dashboard, you’ll see two new plots:
- The Age Breakdown shows the proportion of books in the current set of data which is in the three different key groups: up to 30 days, 1-6 months, and >6 months. Click on each segment to get a popup showing the actual books – you can dig into them here and look at the differences.
- The Books By Author plot shows how many books each unique author has in the plot. This can sometimes look a bit messy, if there are a lot of authors, or authors with very long names – but it works OK. Click each bar to see the actual books published by that author; this is great for seeing the similarities in titles and covers between an author’s books.
Both of these plots update in real-time based on the data in the Data View (above). So if you want to see this information for a subset of books, you can filter the Data View, and all the plots will update automatically.
That’s all for now; if you’ve got any questions about any of this material, please don’t hesitate to email me. In the meantime, I’ll be looking to add some more features to the Dashboard as we go, so stay tuned for more updates.